How to use the Stats Dashboard and how we measure your performance
RebelMouse offers a robust analytics to measure the performance of your distributed content, your editorial team and your site. Our Stats Dashboard feature retrospective data and insights in a visual straight-forward way so everyone can get out as much insights as they want, regardless their statistical knowledge. Our Stats Dashboard is also interactive so you can change what you see according to your main point of interest.
When you login and open the Stats Dashboard, you will arrive to it's default view:
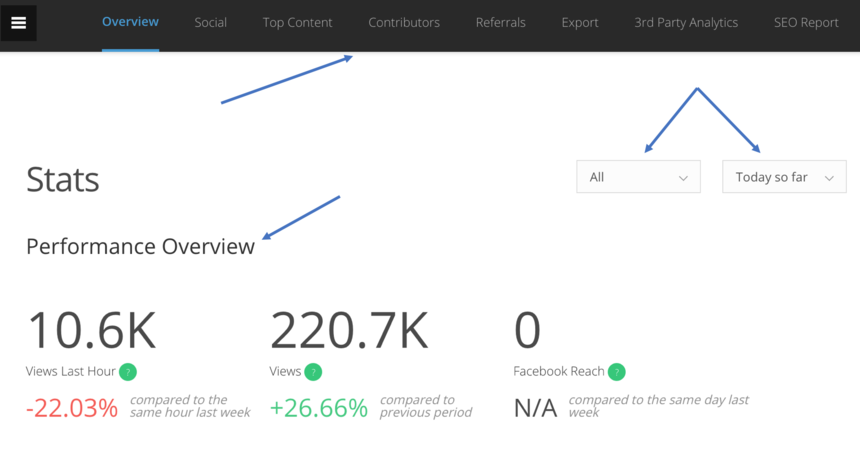
On the top, you will find the hovering Navigation Bar. This will be hovering, no matter where you scroll in the Dashboard. It helps you to navigate easier in the Stats Dashboard. You can quickly jump to the relevant sections highlighted there.
On the right corner, your main interactive drop-down menus will help you to customise the view of the Stats.
First, you can select the relevant Section of your site , once selected a section, the Stats Dashboard's figures will reflect only to that Section. By default, this drop-down menu reflects to all Sections - your complete site.
Second, you can select the timeframe that you want to check.
- There are various preset timeframes from Last Hour till Last 30 days.
- By default the timeframe reflects to the Today so far, which means it shows stats for the day you have logged in so far.
- You can further customise the timeframes by selecting a Custom timeframe in the drop-down menu where you can adjust the calendar to your preference.
- When you select the Custom timeframe, you can pick Exclude posts before the selected date range which will exclude posts from your selected timeframe and only shows posts published in that period.
- By default we show all published posts that have relevant stats to your site.
We want to show you the most important figures first, immediately you logged in.
- Your site performance is on the top for that matter showcasing the Views Last Hour which shows the total views site-wide (all pageviews)
- Views which shows the same metric but for the pre-selected timeframe
- Facebook Reach which shows the reach of your content on your Facebook Page. This metric however cannot be filtered by sections and can only be checked after 24 hours, due that we are getting this metric externally from Facebook.
- The percentage changes - red indicates decrease, green indicates growth - reflect to the previous period in time. Meaning if you select a special day, let's say a Tuesday, the percentage changes will reflect to the last week's Tuesday, not the previous day you have selected - this is due to the nature of content, you most likely get less views in the weekends and more in the weekdays so it is only fair to compare your performance to the same day on the last week. This is also true if you select weeks, multiple days or months.
You can only select 3 months back in the custom timeframe calendar since the day you have logged in.
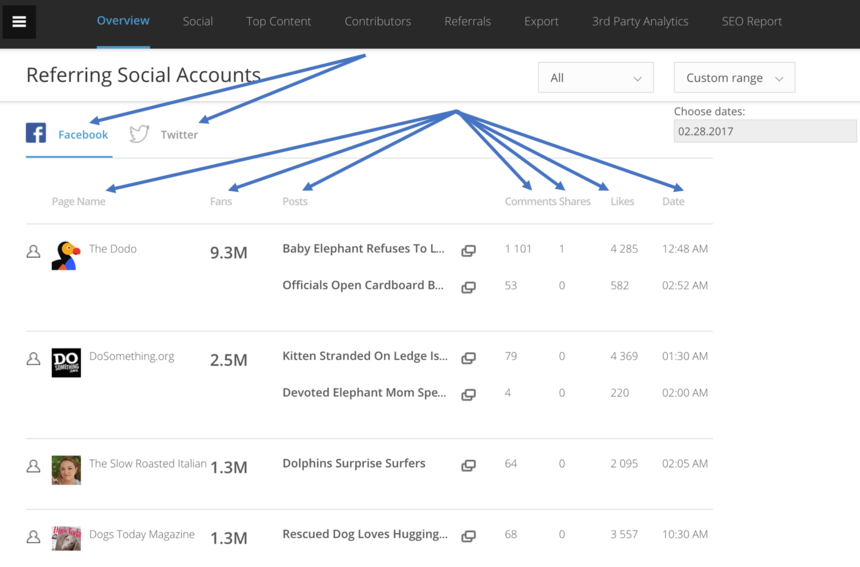
On Referring Social Accounts you can check the social media accounts which have referred your owned content published on RebelMouse.
- These accounts shared your content on their own social media pages, hence referring accounts.
- Currently we offer these figures for the two most important social content sharing platforms, Facebook and Twitter.
- The figures you see in this table all refers to the social media account that has referred your content.
- For Facebook , you can check the name of the page , the number of fans, the social media post itself, the number of comments, shares and likes , and the date when the post was published on that channels.
- All likes, comments, shares are reflect to the likes, comments and shares that particular social media content has generated on its page, not the engagements you have generated on the RebelMouse platform.
- The name of the page and the content itself can be clicked which transfers you to the page itself or the content that has been shared on the page itself.
- You can check the same metrics for Twitter too, but the names of the metrics will reflect to Twitter's own metrics like account name , number of followers, retweets, likes, or the tweet itself.
- We show 10 posts per page per social networks, you can turn the pages by clicking Next or Previous on the interactive table's bottom.
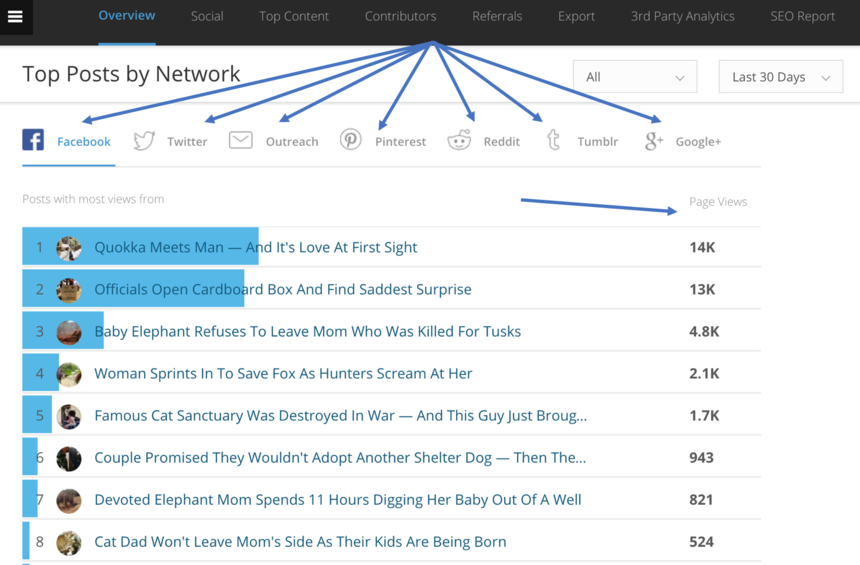
Top Posts by Network table shows you your own content's - published on RebelMouse - popularity per social networks.
- This is the exactly opposite as the last table, where you could check which network prefers to share your content on their own channels, here you can check which content of yours have popularity on social networks.
- You can select Facebook, Twitter, Email Outreach, Pinterest, Reddit, Tumblr and Google Plus to filter down the popularity by social networks.
- We show the name of the post - which is clickable, you can visit the post directly from here on your RebelMouse site - and the amount of Pageviews that the social network generated.
- Note: this is the not the total pageviews for that post, just the amount of pageviews that has been generated by that particular social network.
- This table ultimately shows the referring traffic by social networks for your content.
- As always, you can turn pages forward or backward with Next and Previous buttons on the bottom of the table.
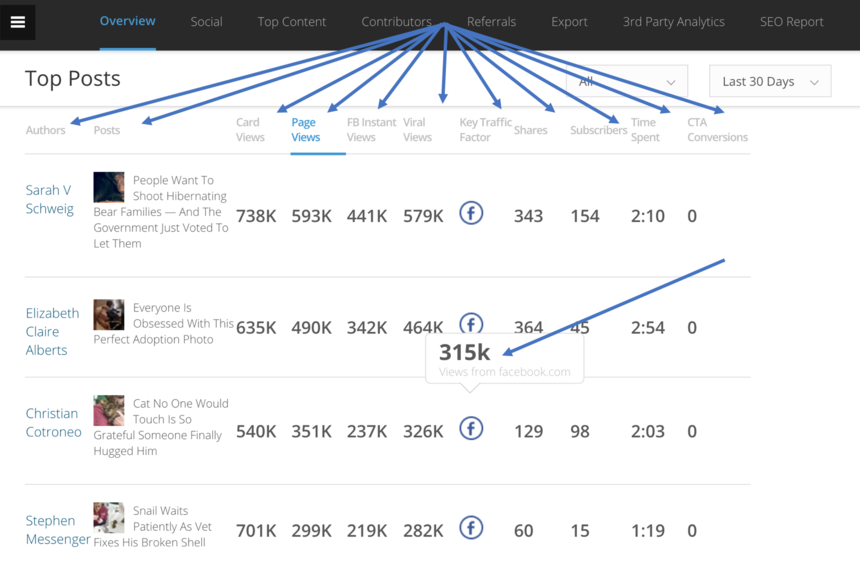
In the Top Posts section, you can check content related metrics.
- If you click any of the metrics on the top, the table will refresh accordingly to the highest figure.
- Author and the Title of the post , both are clickable so you can check them on your own site.
- Card views: the number of content cards shown for that content - users don't need to click in the content, just scrolling to the card to trigger a card view.
- Page views: the number of page views for that piece of content.
- Facebook Instant Article Views: views generated through FBIA
- Viral views: the number of page views that came from an external source to that piece of content - external source can be anything that is not a RebelMouse property.
- Key Traffic Factor: the highest referring source. If you hover your mouse above the icon - in this screenshot the Facebook logo - you can also check the exact figure for that referring source.
- Shares: number of shares happened on RebelMouse platform for that content,
- Subscribers: subscribers to your site triggered on that content
- Time Spent: time spent on that content (minutes:seconds)
- Call-To-Action Conversions: number of CTA conversions if you have any in place.
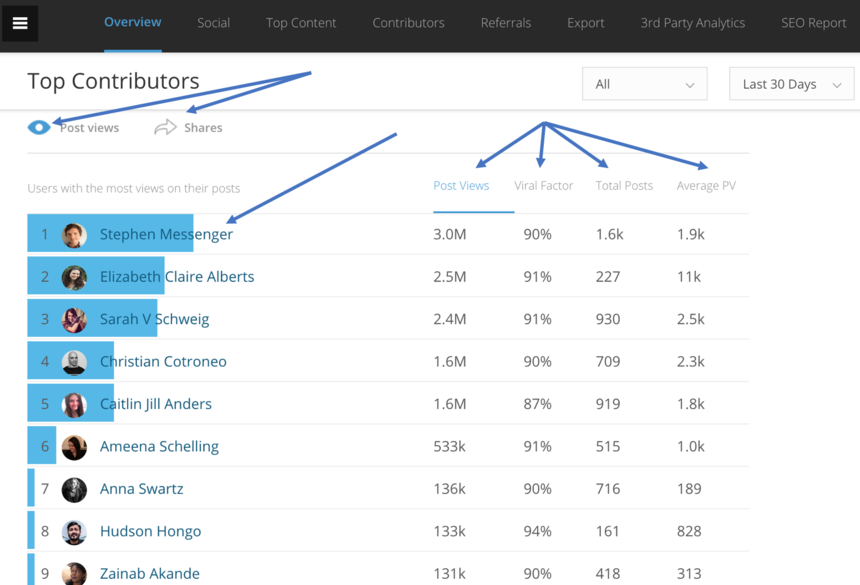
On the Top Contributor table, you can check your editorial team's performance if you have multiple authors. This is highly useful for media companies.
- We offer a segmentation on Post views and Shares so you can check which author generated more views or shares on your site.
- On the left, you can check the author - clickable name to your RebelMouse site - and on the right you can check the metrics per authors.
- By default the table is organised by Post views but you can check Viral Factor - same as viral views in Top Posts - the Total number of posts that author has generated and Average Pageviews generated by those posts.

In the Referrals graphs you can check the referring traffic to your site in more details.
- You can check All Referrals or just the Social Networks and you can get a basic Search Terms report.
- The graphs are interactive, you can view the referrals individually if you hover your mouse over the graphs.
- Amount reflects to Pageviews.
- % reflects to the percentage compared to the total number of pageviews of the site.

At the bottom of the Stats Dashboard we showcase some graphs on your performance.
- Each graphs have a blue and the red graph, where blue means the current period - which you have selected on the top as a timeframe - and the red, which means the previous period. If you hover your mouse above the graphs, you can check the exact figures as well.
First, the Audience graphs .
- Direct Reach: the view of your content across all channels, meaning everything that can be considered as a view is there. This is the impact of your site.
- Engagements: the combined figures of clicks, likes, shares and mouseovers.
- Mouseover: when a user hovers the cursor above a piece of content on the site, showcasing some sort of interest.
- We also show here the total number of engagements and the card views.
- Sign Ups: the number of signups to your site in the given time period.
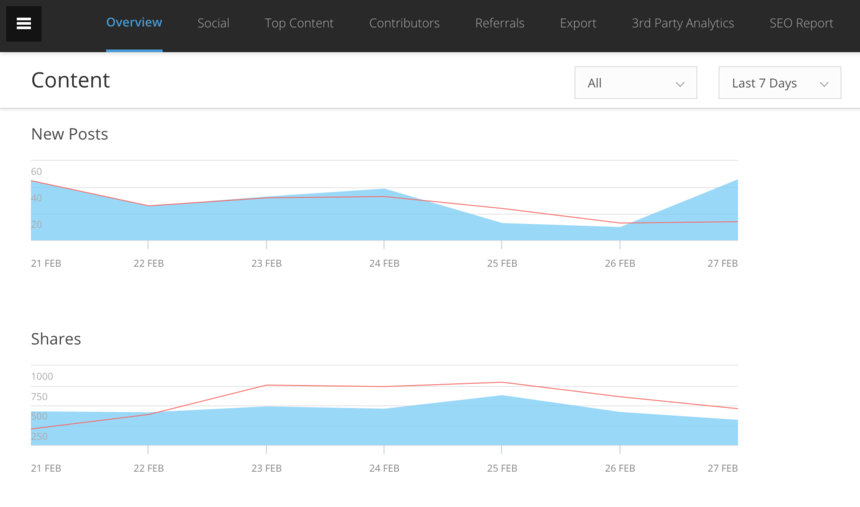
Second, you have the Content Graphs .
- Works like the same as the Audience graphs.
- The first graph shows the number of new posts generated in the given time period
- The second graph shows the number of shares achieved in the given time period.

At the very bottom of the Stats Dashboard, you can Export Your Data.
- The export is a CSV file.
- On the visual Dashboard we only show the important metrics to you, mostly in round-up figures so editors can immediately check the performance of their content.
- For those who want to deep-dive in stats, the exported CSV is a great help.
- In the CSV you will find the exact figures for every metric, segmented figures for engagements (clicks, likes, shares, comments, mouseovers), segmented metrics for social networks, click-through rates, engagement rates, viral percentages and a detailed content performance report.
- The CSV is easy to work with if you are familiar with any data manager tool.
From the Navigation Bar you can also reach 3rd Party Analytics. Here you can easily add 3rd party analytics of your choice to the RebelMouse site, without any coding required.
- Currently we support Google Analytics, ChartBeat Analytics and ComScore Analytics.
Also from the Navigation Bar, you can reach the SEO Report. This is a great help for editors to win more search phrases with their content.
- We show the search phrases you won with which post.
- You can add search phrases to the post manually which will edit the post's URL slug.
- You can also further optimise with search discovery and add tags to your posts.
How to get the most out of the Stats Dashboard:
- Across the Stats Dashboard you can spot little g reen question marks. These help you with instant definitions of metrics and figures, if you hover your mouse above the icon, you will get the definition for each.
- Most of the Stats Dashboard is super interactive. If you see a metric with a content that is on the net (on your platform or on a social network) it is most likely clickable so you can check that content directly from the Stats Dashboard.
- The Stats Dashboard's aim is to get you the most efficient birds eye view on your site and the overall performance of all of your content.
- For individual content stats, you should check the Post Stats for each pieces of content you publish, you will get a more detailed version of the Stats Dashboard.
Every analytics platform is different.
- In case you are measuring your site's performance with another analytics platform - such as Google Analytics - you will see some differences between the two platforms in terms of metrics.
- We suggest you to further investigate in those gaps in figures if that gap is above 5%.
- Gaps below 5% in figures are considered as the nature of analytics platforms and how they measure different metrics.
How to set up redirects in the 404 Dashboard:
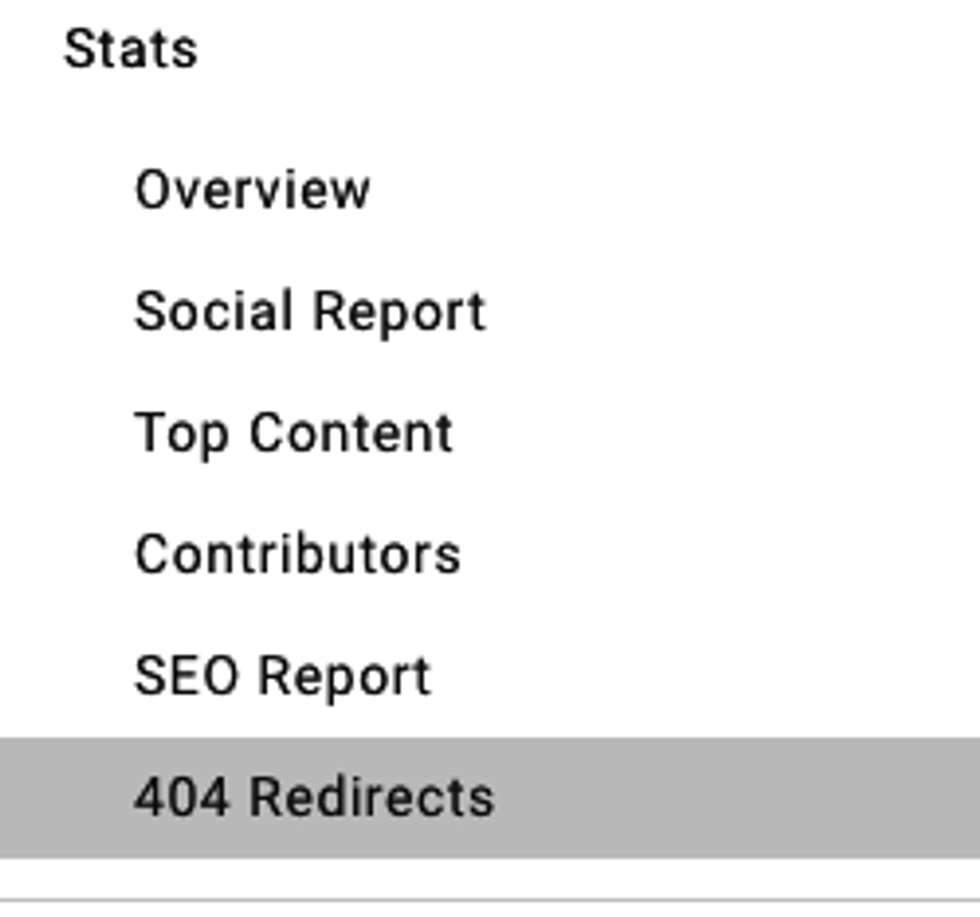
In the left nav, you'll find a link called '404 Dashboard' where you'll be able to set up any 301 or 302 redirects you need on your site.
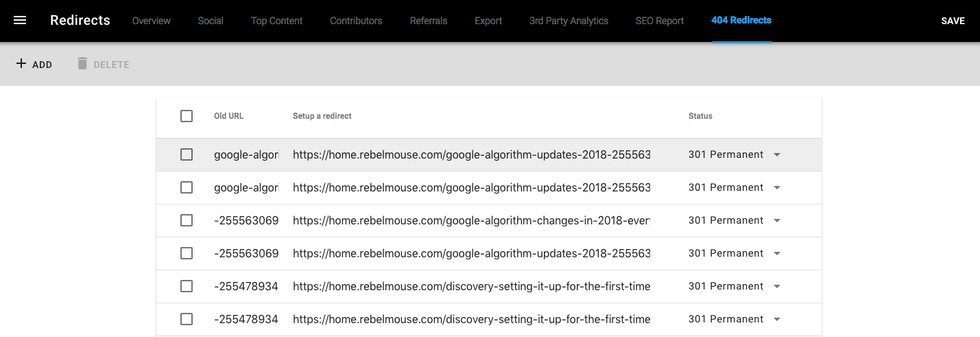
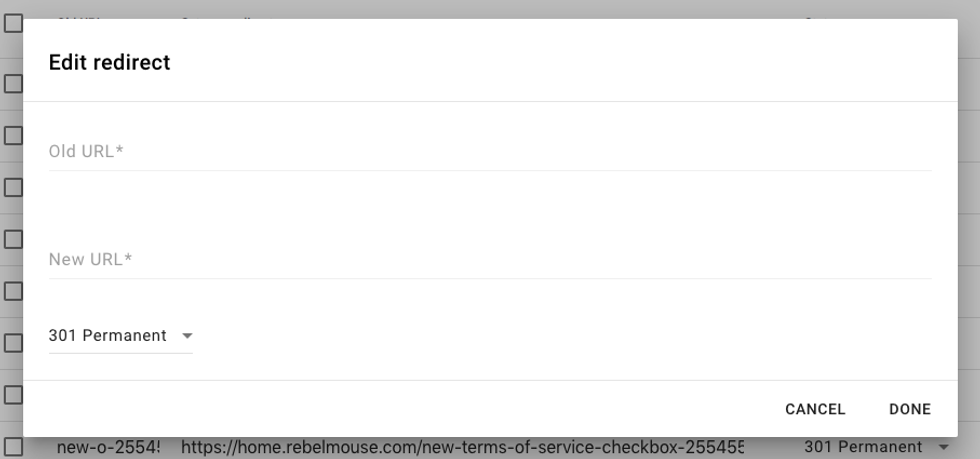
To set up a new redirect, just click on the '+ Add' link on the top left corner. A lightbox will be displayed and it'll prompt you to enter the old url (what's 404ing) and the new url (where you'd like to redirect it to).
You'll also be able to choose the type of redirect: 301 for permanent and 302 for temporary.
