The Right Metrics for Measuring Audience Growth

When we think of audience growth, we tend to latch on to metrics that we believe will give us a good indication of a website's performance. However, this is typically done without isolating variables, which leaves takeaways hard to find.
I've heard from countless clients that it's great to have data in front of you, but what to do with it escapes them. And that underscores the problems with the concept of data itself. Your data set is not a roadmap, it's a set of gauges. In order to know what you should do with your data, it's important to know what each data point really means and why you're treating it as a key performance indicator (KPI).
I know this sounds obvious, but there are plenty of misunderstandings of common metrics which, unfortunately, lead to focusing on the wrong things. We must learn to interpret our data properly before we can know what decisions to make from it. To do this, we need to realize that all metrics are not the same and some are affected by unforeseen or hidden variables more than others.
Focus on User-Based Metrics
A good majority of the 'standard' metrics are session-based, but a 'session' is the wrong baseline. It's more useful to analyze and track user-based metrics instead because session-based metrics can be somewhat misleading in the context of audience growth. After all, we're trying to measure KPIs that are based on the habits of people (users), not fragments of what they do (sessions).
For example, let's say a single user comes to your site three times today and their visits looked like this:
- Session #1: Reads one page, leaves.
- Session #2: Reads two pages, leaves.
- Session #3: Reads one page, leaves.
The 'Pages per Session' metric for this user would be 1.33, but that doesn't tell the whole story. The 'Pages per User' would be 4.00. The session didn't read the pages, the person did, and they read four.
As a publisher, this is a critical distinction when it comes to measuring engagement and loyalty. It really doesn't matter if a user reads four articles across three sessions (1.33 pages per session) They still read four articles, which is more valuable than a user that reads two articles in one session (2.00 pages per session) and never comes back. In this case, the session-based metric rewards the weaker overall user.
It's also worth noting that in our example above, two of those visits would be counted as bounced sessions, for a bounce rate of 66%. This doesn't paint a useful picture of what makes a valuable consumer of your content. The frequency of visits gets lost in the equation when you take a metric like bounce rate and apply it with a broad brush. By relying on session-based metrics, we're diluting the actionable insights that we can gain from our data. Wherever possible, we should be using our visitors as the starting point instead.
Creating Better KPIs for Audience Growth
Luckily, there's an opportunity to customize metrics within tools like Google Analytics and Google Data Studio so we can drill down to what is actually meaningful for publishers. Here are a few of the metrics we standardize on:
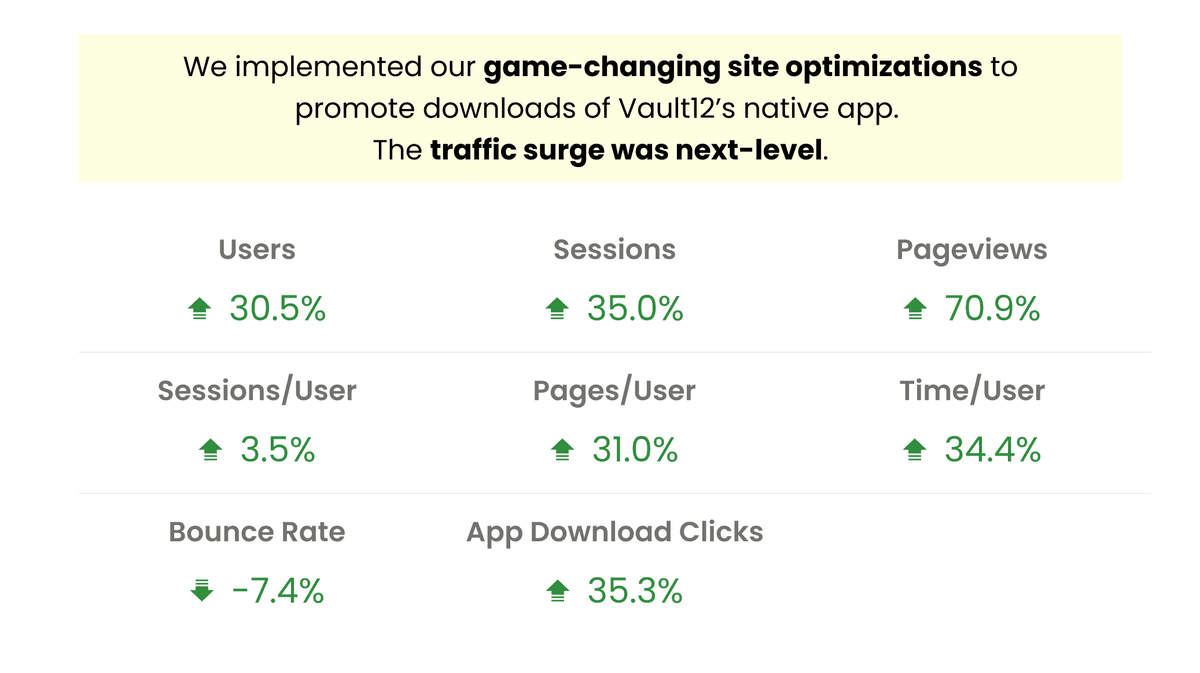
Sessions per User: This metric measures the average number of sessions that each user has in a given time period, and provides a visit frequency metric on a user basis.
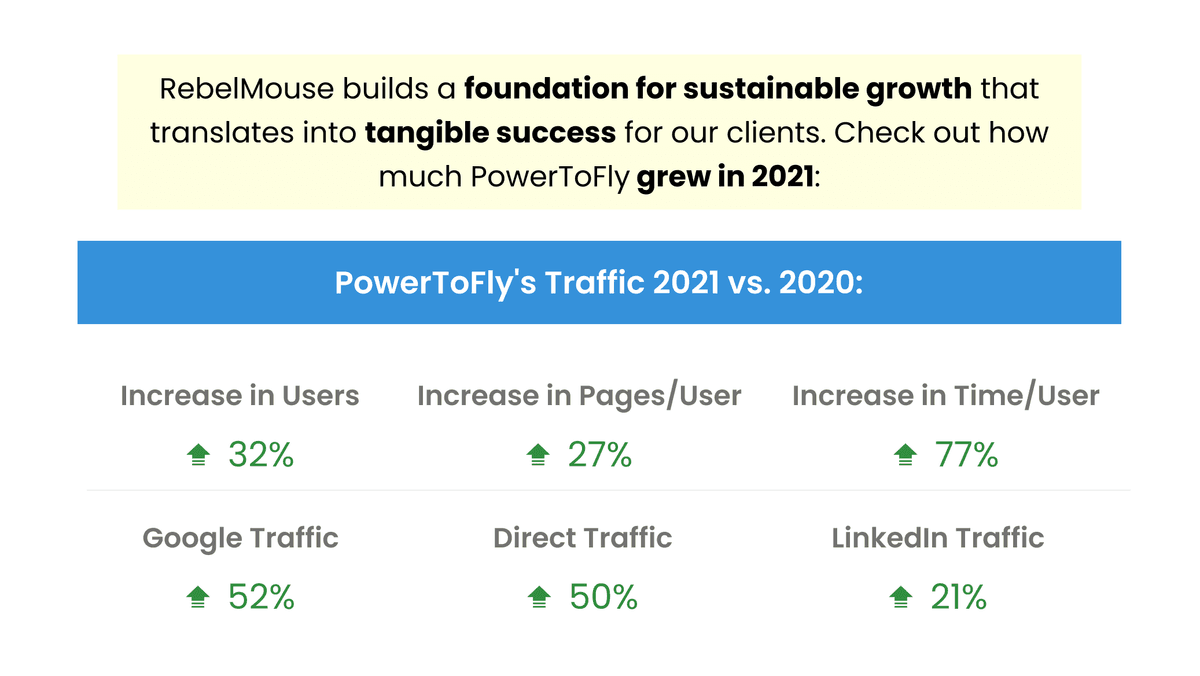
Pages per User: This metric measures the average number of pageviews that each user has in a given time period. This can be used in place of 'Pages per Session.'
Time per User: This metric measures the average amount of time spent on your site by each user. This can be used in place of 'Avg. Time on Page' or 'Avg. Session Time,' and provides a more defined view of how long each user is spending on your page/site.
Used together, these custom metrics help define the core behavior of a site's user base. For publishers, 'Pageviews' are largely article views, so these metrics answer three critical questions:
- Frequency: How often are users coming to our site?
- Depth: How many articles does each user consume?
- Duration: How long is each user staying on the site?
By focusing on these three metrics as your KPIs, you're putting audience growth at the forefront of your data analysis efforts and setting yourself up for long-term success.
Note: Google Analytics calculates the time a user spends between the first page and the second page to calculate its Average Time on Page metric. This can sometimes skew data. For more reliable insights, it's best to refer to the Time/User column in RebelMouse's Google Data Studio dashboard on the Content Performance page.
We Can Grow Together
We have a lot of mantras at RebelMouse. One of them is "Take big data and make it little again." We live close to our clients' insights so we can help them track trends, victories, and even pitfalls. Then, we distill this data to help content creators adjust their digital strategy in a way that actually moves the needle. Our global team is well-versed in every audience-building discipline, and our guidance is backed and tested against mountains of data we've collected over the years. Publishers have enough to juggle in the current digital climate. Let's focus on the right metrics together and cut out the noise. Request a proposal today to get started.


